
Choosing between tap water and bottled water can feel confusing when headlines report everything from a few plastic particles to hundreds of thousands per litre. Those figures may sound like answers to the same question, but they often describe different particle sizes, different samples and different laboratory methods.
Microplastics research does show that plastic particles can be detected in drinking water. It does not provide a simple global ranking in which every bottle contains more than every tap. To make a useful comparison, we need to know what was measured and what the result actually represents.
This article looks at the often-cited bottled-water study reporting approximately 240,000 particles per litre, available Dutch tap-water information and practical choices. The aim is to help you read the evidence without treating detection as a diagnosis or an unmeasured particle as proof of absence.
What are microplastics and nanoplastics?
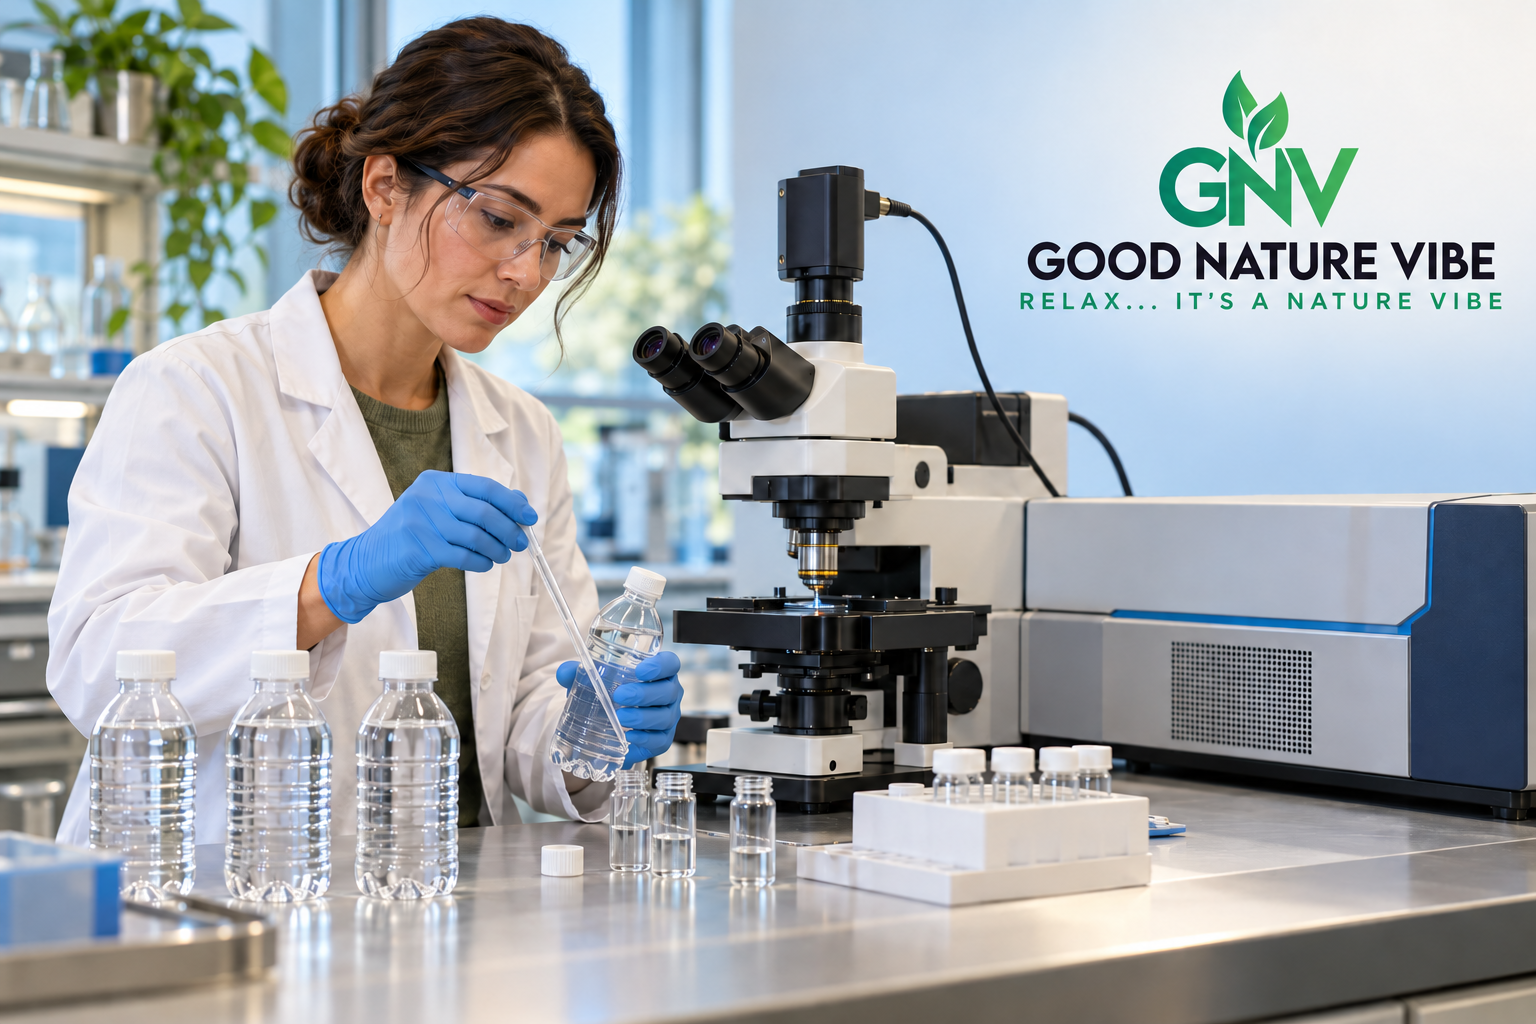
Microplastics are small plastic particles, commonly described as smaller than five millimetres. Nanoplastics occupy an even smaller size range. Definitions differ across research, so a study's stated size boundaries matter more than a headline using one broad label.
A method looking for particles above 20 micrometres cannot tell us how many smaller particles are present. A more sensitive method may reveal a much larger population without the water itself having changed. This is one reason newer research can produce far higher counts.
Particle number and particle mass also describe different things. One large fragment can weigh more than many tiny particles combined. Neither measure, by itself, gives a complete answer about exposure or health effects.
For wider background on microplastics, read our separate article on their presence in water, food and air. Drinking water is one part of the subject, and conclusions about it should remain tied to drinking-water evidence.
What did Qian's bottled-water study find?
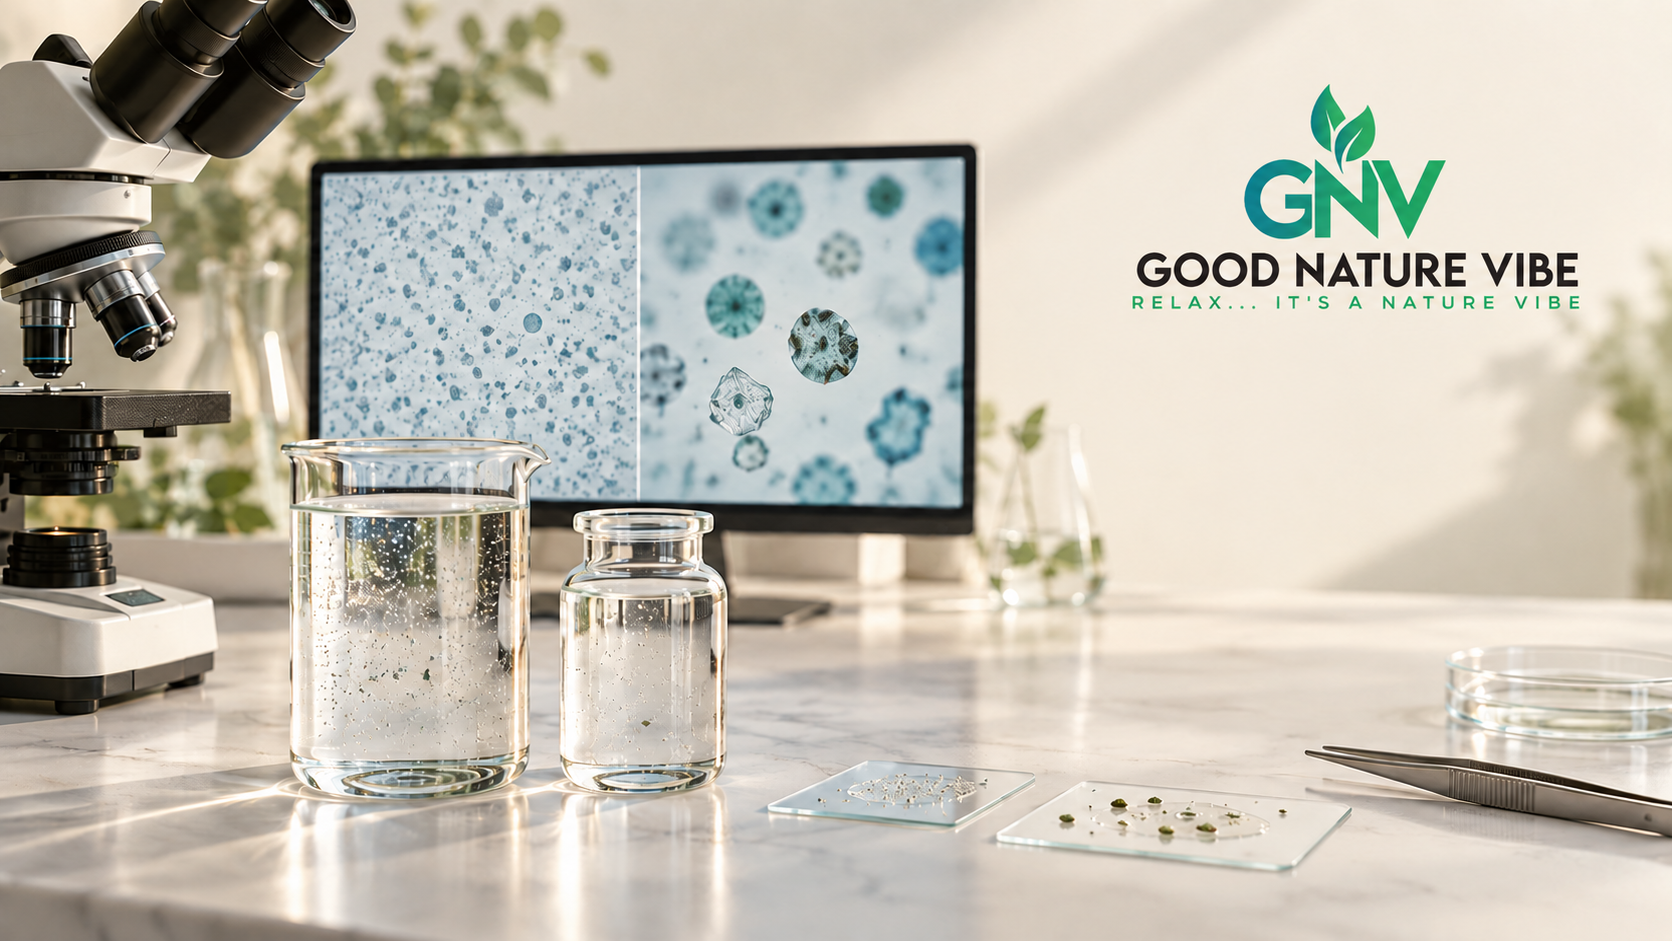
In 2024, Naixin Qian and colleagues published research using stimulated Raman scattering microscopy to identify plastic particles at very small sizes. The study examined three unnamed US bottled-water brands, with five samples per brand: fifteen samples overall.
The researchers estimated an average of approximately 240,000 microplastic and nanoplastic particles per litre, with reported levels roughly between 110,000 and 370,000. About 90% of the identified plastic particles were nanoplastics.
The often-repeated description of 10 to 100 times more particles relates to what this more sensitive approach revealed compared with earlier estimates. It does not show that bottled water suddenly became that much more contaminated. Improved detection brought previously difficult-to-measure particles into view.
The experiment did not include Dutch tap water as a matching comparison. Its figures should therefore be reported as findings from these US bottled-water samples, rather than a worldwide value or a direct measurement of the difference between Dutch taps and bottles.
What the result helps us understand
The study demonstrates why looking at smaller particles changes the picture. It also gives readers a practical question to ask whenever a new number appears: did the researchers count only microplastics, or did they include nanoplastics as well?
What it cannot tell us
Fifteen samples cannot represent every brand, packaging material, production batch or country. The paper was also not a trial of health outcomes in people drinking the sampled water. Its particle count should not be converted into a prediction of a particular illness.
What do we know about Dutch tap water?
A 2025 KWR sector publication describes Dutch tap water as containing only a few measurable microplastic particles per litre. This supports a picture of low measured counts within the methods used; it does not establish that every supply has the same result.
Waternet gives a more specific public figure for its own water: approximately one measured microplastic particle per 71 litres. Dividing one by 71 gives about 0.014 particles per litre. That is a local communication, not a national average and not a measurement of all possible nanoplastics.
These findings must retain their measurement boundaries. A low count can be reassuring about the particles the method examines while leaving smaller particles outside its scope. Waternet's figure and the KWR summary should not be merged into one uniform Dutch result.
For your home, look for information from the supplier responsible for your address. Ask about sample location, particle-size range and date if the published explanation is unclear. A national overview provides context; a local report answers a more specific question.
Why the numbers are not directly comparable
The Qian estimate and Waternet's figure should not be divided to calculate how many times “worse” bottled water is. Doing so would make the result look precise while ignoring that the underlying measurements address different particle populations.
Imagine one test counting objects larger than grains of sand and another counting dust as well. A much higher count in the second test would not isolate the difference between the materials being tested. It would also reflect the additional objects the method can see.
Microplastics studies vary in several important ways:
- Size threshold: the smallest particle that can be detected and identified.
- Sample: source water, treated water, a building tap or a particular bottled product.
- Identification: confirmation of the polymer, rather than simply counting visible objects.
- Reporting: particles per litre, mass per litre or another measure.
- Quality control: checks for particles introduced during collection and analysis.
Before comparing two articles, make a short note of these five points. If several are missing, the numbers may still be useful individually, but they do not support a clean comparison.
Tap water vs bottled water: what can we conclude?
We can say that plastic particles have been reported in both water types. We can also say that the sampled bottled water in Qian's experiment contained a substantial number of tiny particles, while Dutch sector information reports low measured microplastic counts within its own methods.
We cannot conclude from those findings alone that all bottled water is always more contaminated than all tap water. Nor can we conclude that Dutch tap water contains no nanoplastics merely because the quoted microplastic numbers are low.
A stronger comparison would test both water types with a compatible method, cover the same size range and include enough sources, brands and repeated samples. That is the kind of design to look for before accepting a broad ranking.
For an everyday decision, include other practical considerations: local drinking-water guidance, availability, cost, packaging waste and whether you have a specific documented concern. A transparent comparison can acknowledge these factors without pretending that one particle count settles everything.
Does finding particles prove a health risk?
The World Health Organization's 2019 drinking-water review identified important gaps in evidence about microplastic exposure and health effects. It should be described as an assessment of the information available at that time, rather than a permanent guarantee about all particles and every exposure.
A detection result answers a narrower question than a health study. Establishing risk requires evidence about the particles, the relevant dose, duration of exposure and biological effects. A count does not provide those answers on its own.
This is why a sensible response avoids both exaggerated certainty and alarming predictions. Research gaps justify better measurement and further investigation. They do not justify attaching a disease forecast to the Qian average or telling readers that any detected particle proves their water is unsafe.
Practical choices you can make

Start with your local water information
Check your supplier's current quality information and any notices affecting your area. Follow official local instructions if an incident occurs. Do not replace those instructions with a general blog, a filter advertisement or a report about another country.
If you are comparing options, write down what you actually need to resolve. Is it packaging waste, taste, a documented water-quality issue or general concern about headlines? Each question calls for different evidence.
Use a suitable reusable bottle
Where local tap water is suitable for drinking, a durable reusable bottle can reduce reliance on single-use packaging. Choose one intended for repeated food contact, and clean the bottle, cap and seals according to the manufacturer's instructions.
Glass and stainless steel are practical alternatives for some routines. Glass can be heavier and more fragile, so select a container that suits where you will use it. Neither material should be advertised as a guarantee that the water inside contains no particles.
Store water and food appropriately
Follow bottled-water storage advice and avoid leaving containers unnecessarily in direct sunlight or a hot car. Do not infer an exact particle count from storage temperature: that would require testing the particular product under defined conditions.
For food storage, use glass where it suits the purpose, especially if you want to reduce unnecessary plastic contact. Heat food only in containers explicitly designed for that use. Replacing a scratched or damaged container is a practical maintenance choice, not a promise of zero exposure.
Treat filter claims as questions to verify
Ask which particle sizes were tested, how performance was measured, over what capacity and with what maintenance. “Purifies water” does not tell you whether a device was tested for microplastics, nanoplastics or either.
Chemical pollutants raise separate questions. Our article on PFAS water explains why drinking-water results and assessment values need context. A result about plastic particles should not be used as evidence of PFAS removal, or the reverse.
If you choose a filter, record installation and replacement dates. An equipment purchase does not replace local water-safety instructions, and a manufacturer's percentage means little without the associated test conditions.
Reduce textile fibres at their source
For synthetic clothing, consider a suitable laundry bag designed to reduce fibre release or a compatible washing-machine filter. In a 2020 study of six devices, reductions in fibres reaching wastewater varied between devices: approximately 21% to 78%, with the tested laundry bag achieving about 54%. These are study-specific results, not guaranteed performance for every product.
Choose the lowest wash temperature appropriate to the garment, cleaning need and hygiene requirements; for some everyday clothes this may be 30°C. Follow care labels and necessary hygiene guidance. Temperature alone does not establish a universal reduction percentage.
Dispose of collected fibres in household waste according to local instructions, rather than rinsing them down the sink. These actions concern environmental releases from laundry. They cannot be converted into a known reduction in particles in your drinking glass.
Keep waste out of the environment
Use refill options where practical, sort packaging according to local collection rules and prevent litter. These are straightforward ways to avoid adding more plastic waste. They do not require consumers to believe they can personally eliminate every microscopic particle.
Frequently asked questions
Does tap water contain microplastics?
Research can detect microplastics in tap water. Dutch sector reporting describes low measured counts within the methods used. Results depend on location and particle-size range; low counts should not be described as complete absence.
Does every litre of bottled water contain 240,000 particles?
No. That approximate average came from fifteen samples of three US brands in Qian's study and included microplastics and nanoplastics. It is not a universal number for all bottles.
Does a higher particle count automatically mean greater harm?
No. Number is one measurement. Particle size, material, exposure and biological evidence also matter. The quoted studies do not support a personal health prediction based on their counts.
Are glass bottles always particle-free?
A container material alone does not establish the composition of its contents. The water source, processing and other components remain relevant. An absence claim requires an appropriate test and clearly stated measurement limits.
Can any household filter remove nanoplastics?
A generic filtration claim is insufficient. Check evidence for the exact model and the particle sizes tested. Do not assume that a test involving larger microplastics also demonstrates nanoplastic removal.
Good Nature Vibe: clarity before conclusions
Good Nature Vibe aims to make environmental research understandable without overstating it. A useful explanation gives the actual numbers, shows where they came from and states what they cannot establish.
For further articles on environmental research and wellbeing, explore our health news category. Careful interpretation gives readers better questions to ask and a stronger basis for everyday decisions.
Conclusion
The tap water vs bottled water question does not have one global microplastics number as its answer. Qian's study revealed approximately 240,000 microplastic and nanoplastic particles per litre in a limited US bottled-water sample, while Dutch information reports low measured microplastic counts under different methods.
Those observations should inform the discussion without becoming a misleading numerical ranking. Check local guidance, read measurement limits and ask for evidence behind product claims. Practical choices about reusable containers, storage, laundry and waste can reduce unnecessary plastic use without promising complete avoidance.


